2023 NASA Summer Research Intern
University of Delaware
Andrew Ngo is a Sophomore at University of Delaware studying Computer Science with minors in Math and Statistics. He is spending this summer interning at NASA’s Ames Research Center.
Andrew’s Research Report:
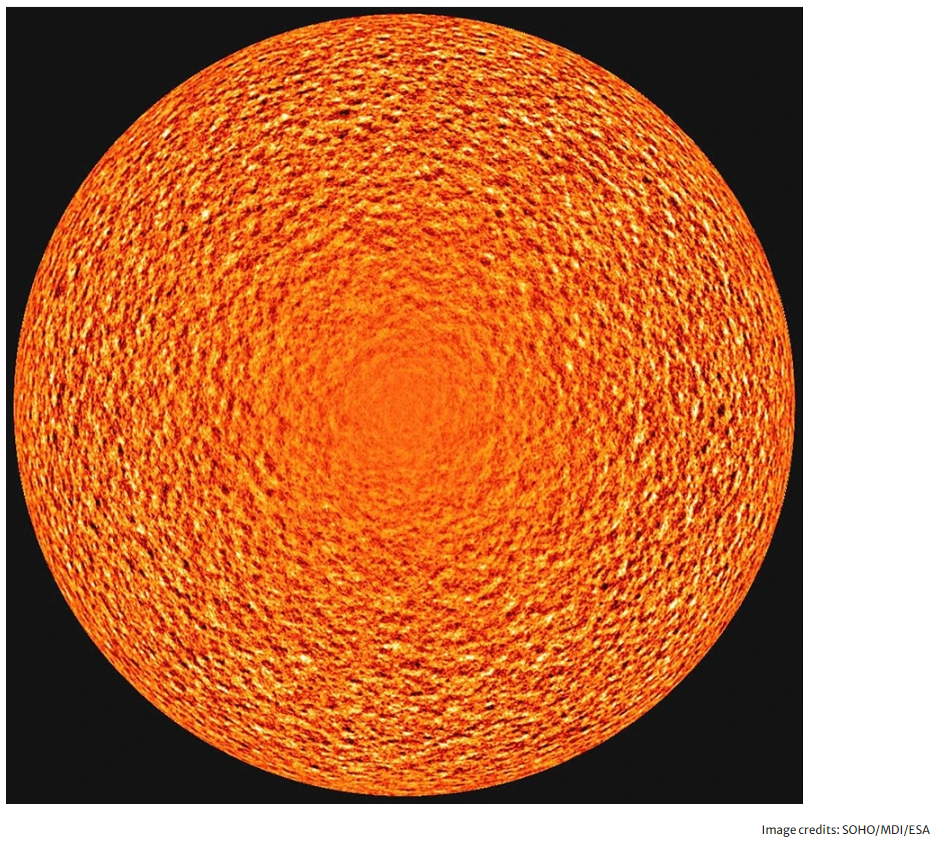
During my 10 weeks working with the heliophysics team at NASA Advanced Supercomputing Division, I researched various computer vision methods to develop a digital image processing pipeline which segments supergranules on horizontal flow divergence maps of the solar surface derived from SDO/SOHO data of horizontal velocity maps processed by Dr. Junwei Zhao from Stanford University.
Supergranulation is a fluid-dynamical phenomenon taking place in the sun’s photosphere and typically have been researched to possess a diameter of 20-30 megameters (Mm) and dynamical evolution time of 24-48 hours with strong 300-400 m/s horizontal flows but weaker 20-30 m/s vertical components. According to Zhao’s research, high divergence values on horizontal flow divergence maps derived from
the horizontal velocity maps at a depth of 1-3 Mm indicate supergranules. Generally, these regions of high divergence should be circular or elliptical in appearance. The divergence maps span 120 degrees in both longitudinal and latitudinal directions. After I derived daily divergence maps for all dates from May 2010 to May 2023, I needed to develop my segmentation pipeline to apply to all computed divergence maps.
First, the divergence map is cropped latitudinally from -30 to 30 degrees because the map outside of this range becomes stretched, which would give us inaccurate supergranule properties. Then, I grayscale the image so that we can apply OpenCV library functions. Before this, we must normalize the
divergence map; I normalized all of my images to be in the range of a mean pixel intensity of 147 where 0 is the minimum and 255 is the maximum. However, this may be ineffective and future research should apply improved normalization that guarantees all divergence maps have the same brightness and contrast. Afterwards, we apply Gaussian smoothing to the image to reduce noise artifacts and thus increase the effectiveness of thresholding by making the supergranulation easier to see. Then, contrast-limited
adaptive histogram equalization (CLAHE) is applied to this result to increase contrast and edges, thus making both clear and small, blurrier bright areas more pronounced. This also aids us in visual inspection to assess the pipeline’s segmentation. Manual thresholding is applied to the divergence map to produce a binarized map of the supergranules; before, I had tried adaptive thresholding techniques but to little benefit. I defined my threshold to only keep values between 155 and 255 pixel intensity. Morphological opening is then applied to remove very small white dots which are likely not supergranules.
Laplacian of Gaussian Blob Detection is used from SciKit-Learn library to detect blobs on this morphologically opened threshold, which does a fairly great job at segmenting individual supergranules in thresholded supergranule clusters (originally, these supergranules were very close in proximity) and small, blurry supergranules in the background when we draw and visually inspect the detected blobs on the equalized image obtained before thresholding.
Afterwards, I identified all active region coordinates on magnetograms corresponding to each divergence map’s date, and created a bounding radius around the active regions where any blob within this radius is removed. We filter this because active regions also have high horizontal flow divergence values, which are then misidentified as supergranules.
With these segmentations, I computed the number and average area, diameter, and divergence value of the supergranules for each divergence map. Finally, obtaining sunspot number data from the Royal Observatory of Belgium, I plotted these properties in relation with the sunspot number to analyze correlations over time. As expected, I found that supergranule number and diameter decreases as sunspot
number increases and vice versa, which confirms results from previous research studies in 2008 and 2017. I also found that supergranule divergence value decreases as sunspot number increases and vice versa, however I’m not certain about this result because computed divergence maps around 2018 to 2020 were significantly brighter relative to other maps.