
Summer Researcher with Dr. Sarah Dodson-Robinson
Physics, Computer Science
University of Delaware
My name is Andrew Fonseca, and I am a junior at University of Delaware currently following a physics degree plan with an astrophysics concentration, along with a computer science minor. I am a first-generation college student trying to engage more in research regarding my astrophysics concentration, and hope to learn more about this interesting field. Outside of school, I like to watch movies and listen to music. I try my best in what I like to do, and hope I can make use of my time this summer doing this research with the help of the Delaware space grant.
Andrew’s Research Summary:
Over the summer, I worked with Professor Dodson-Robinson and her research group on testing methods for validating planet discoveries by view characteristics of nearby stars. For computational methods we used, NWelch was the main one, as it could estimate the power spectra, complex cross-correlation, and bivariate time series, which all helped in the analysis of these stars. To get started, I first looked at the star GJ 625 to start within with these methods of computation and analysis. GJ 625 was an unremarkable star, but it helped to familiarize myself with NWelch and for what to look out for when analyzing a star to get a better picture of what it is like. I then moved on to the star GJ 3942, which showed the difference between its recorded rotational period from the dataset, and what I was finding within the coherence. GJ 3942 was said to have a rotational period of roughly 16 days, but I was finding significance within a rotational period of 32 days. This can be due to the recording only measuring the to one spot of the star, rather than the full rotational period of the star.
Introduction
Over the summer, I worked with Professor Dodson-Robinson’s research group on testing methods for validating planet discoveries from nearby stars. One method we used was the radial velocity method, where we observe alternating redshift and blueshift from the star wobbling around the center of mass within the star-planet system. I had looked at a few different stars, but the star that had the most focus was GJ 3942. In analyzing the star, we used NWelch, a computational method used to analyze the properties of GJ 3942 and other stars. After collecting the coherence of the star, we moved on to fake data iteration to validate our findings.
NWelch
NWelch is one of the computational methods used in calculating the time series, power spectrum, and coherence of different types of planets. It is a python implementation of Welch’s method to estimate the power spectra, magnitude-squared coherence, complex crossspectrum, and phase spectrum of unevenly spaced, bivariate
time series. It was used for different tasks in a bivariate time series. Such tasks are the Siegel’s test for periodicity in a time series, calculating spectral windows resulting from uneven time sampling with taper, Lomb Scargle-like periodograms, as well as coherence
false alarm levels and bootstrap false alarm thresholds for coherence and Welch’s periodogram.
GJ 625
Using NWelch, I could calculate the time series, power spectrum, and coherence of a star using different data pipelines, such as the radial velocity from the TERRA pipeline (RVT), or the radial velocity from the DRS pipeline (RVY). Using the Template Enhanced Radial velocity Re-analysis Application (TERRA) pipeline is more reliable than the Data Reduction Software (DRS) pipeline because the TERRA pipeline can handle the big process of unpacking the HARPS-N archive files in the DRS output. HARPS-N is the planet search that finds these radial velocities with high accuracy for stars within the Northern hemisphere. The first star that I had analyzed using NWelch was GJ625, a M-type star with an exoplanet orbiting it. With a rotational period of 14.6 days, it would be approximately 0.6 billion years old.
With the data pipelines of this star, we could compare the RVT and RVY to the H alpha to get power spectrum and coherence plots, which would provide more information about the characteristics of the star.
Coherence
To get to the coherences, you would first have to get the time series of the data pipeline and H alpha. You would need to then segment the data seen from the periodogram, and you could include a taper when segmenting the data. Next, you could calculate the Welch coherence power spectrum, along with the bootstrap and find false alarm thresholds. After the coherence power spectrum is done, a Siegel’s test can be performed and the coherence can be plotted. You can also plot the spectral window and the Welch power spectrum plot of the data pipeline and H alpha. The same process is also done when comparing the data pipelines with the S index. The S index is the spectroscopic measure of chromospheric activity on other stars, while the H alpha index is the emissions of H alpha from the measured star.
GJ 3942
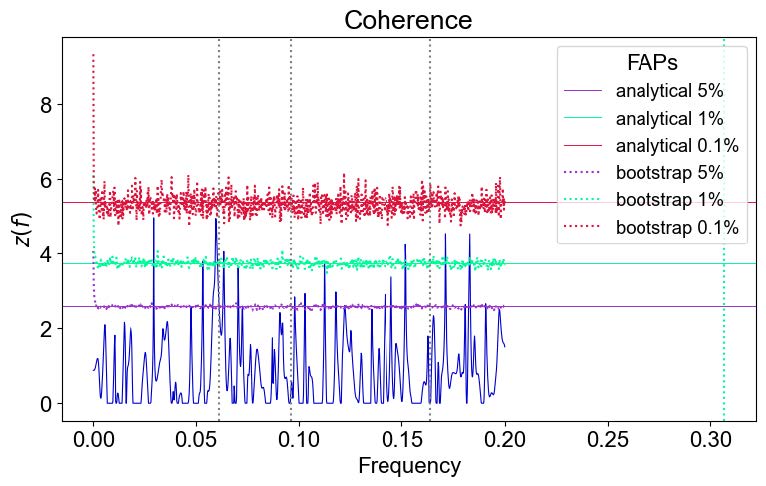
After calculating the coherences and power spectrums of GJ 625, we started on GJ 3942. Similarly, it is a Mtype star with a fast rotational period. Using NWelch to calculate coherence for GJ3942, the rotational period of the star was found to be more than what was originally found, from a radial velocity of 16.3 days to 32.4 days,
roughly double. The original paper had stated that the photometric data of the APACHE and EXORAP programs found a 16-day rotational period, but all smaller signals shorter than ¡100 days were related to the main periodicity and were corrected for after pre-whitening the rotational periodicity. This could be due to the measuring of the rotation of the star, as this could be one
spot of the star being recorded, rather than the full rotational
period of the star, as well as the correction after pre-whitening. The coherence of each data pipeline also shows this larger rotational period when plotted, which can seen in Fig. [1].
Fake Data Analysis
Just like GJ 625, we went through the process of comparing the data pipelines with the Hα index and S index. The Hα index is a index of the deep-red visible spectral line from hydrogen atoms that can be recorded from a star. The S index is an index of the CaII H and K spectral lines that can be recorded, which proved a more narrow band to observe. After that process, we also compared the RVT to fake data to assess the data pipelines. The comparison with the fake data followed what was said about the rotational period before. We had also done 10000 iteration on this fake data to create a fake transformed coherence. With this fake transformed coherence, three histograms of coherence counts at each frequency in the frequency grid, which can then be graphed. It was also possible to plot the coherences of different activity indicators with the fake data.
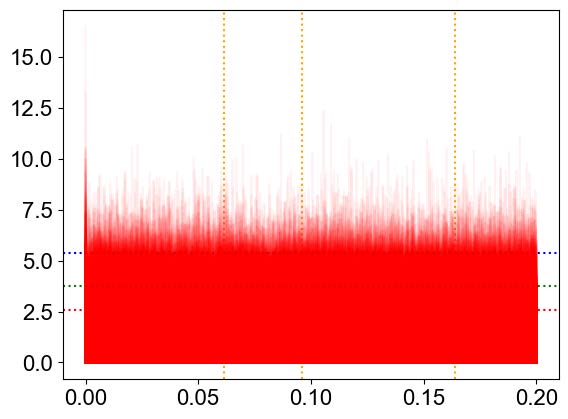
Fake Data Comparison
We could also compare fake data to fake data to be able to see if anything is wrong with our power spectrum. Looking at Fig. [2], we can see that there are no spikes around our stellar signals, so there is no significance when comparing them to fake data. This shows that there is little to no bias or anomalies around our stellar signals, meaning we can trust this data. I had also did this comparing Hα and the S index to fake data to validate the related data. The coherence of the fake data also showed no significance relating to the Hα and
S index data.
Conclusion
In conclusion, I was able to familiarize myself with computational methods of analysis to find properties of star that can help validate finding pertaining to certain planets near said star. In the analysis of GJ 3942, it showed irregular properties when comparing to what was recorded, such as the rotational period being double of what was recorded previously. GJ 3942 warrants to further looked into to verify whether these discrepancies are accurate by using other methods of analysis, such as NWelch.
Works Cited
[1] Dodson-Robinson, Sarah E., et al. “Magnitude-Squared
Coherence: A Powerful Tool for Disentangling Doppler
Planet Discoveries from Stellar Activity.” The Astronomical
Journal, vol. 163, no. 4, Apr. 2022, p. 169. arXiv.org,
https://doi.org/10.3847/1538-3881/ac52ed
[2] Reiners, Ansgar, and Gibor Basri. “Chromospheric Activity,
Rotation, and Rotational Braking in M and L Dwarfs.”
The Astrophysical Journal, vol. 684, no. 2, Sept. 2008, pp.
1390–403. arXiv.org, https://doi.org/10.1086/590073
[3] Delfosse, X., et al. “Rotation and Chromospheric
Activity in Field M Dwarfs.” Astronomy and Astrophysics,
vol. 331, Mar. 1998, pp. 581–95. NASA ADS,
https://articles.adsabs.harvard.edu/pdf/1998A%26A…331..581D
[4] Perger, M., et al. “HADES RV Programme with HARPSN
at TNG VI. GJ 3942 b behind Dominant Activity
Signals.” Astronomy & Astrophysics, vol. 608, Dec.
2017, p. A63. arXiv.org, https://doi.org/10.1051/0004-
6361/201731307
[5] Su´arez Mascare˜no, A., et al. “HADES RV Programme
with HARPS-N at TNG: V. A Super-Earth on the Inner
Edge of the Habitable Zone of the Nearby M Dwarf GJ
625.” Astronomy & Astrophysics, vol. 605, Sept. 2017, p.
A92. DOI.org (Crossref), https://doi.org/10.1051/0004-
6361/201730957
[6] Anglada-Escud´e, Guillem, and R. Paul Butler. “THE
HARPS-TERRA PROJECT. I. DESCRIPTION OF THE
ALGORITHMS, PERFORMANCE, AND NEW MEASUREMENTS ON A FEW REMARKABLE STARS OBSERVED
BY HARPS.” The Astrophysical Journal Supplement
Series, vol. 200, no. 2, June 2012, p. 15. DOI.org
(Crossref), https://doi.org/10.1088/0067-0049/200/2/15
[7] Silva, A. M., et al. “A Novel Framework for Semi-
Bayesian Radial Velocities through Template Matching.”
Astronomy & Astrophysics, vol. 663, July 2022, p.
A143. DOI.org (Crossref), https://doi.org/10.1051/0004-6361/202142262.
[8] Anglada-Escud´e, Guillem, and R. Paul Butler. “The
HARPS-TERRA Project I. Description of the Algorithms,
Performance and New Measurements on a Few Remarkable
Stars Observed by HARPS.” The Astrophysical Journal
Supplement Series, vol. 200, no. 2, June 2012, p. 15.
arXiv.org, https://doi.org/10.1088/0067-0049/200/2/15.